
Your learning program is having an impact on important business metrics. Learn how to prove it with data.
Measurement matters
There’s an old Zen koan:
“If a business KPI improves and no one is around to measure it, does the C-suite care?”
The question has frustrated L&D professionals (and monks) for ages. Recently, that frustration has increased. Organizations quantify the CPM of their ad campaigns, the quota attainment of their sales teams, and their customer acquisition cost (CAC). On a human level, we quantify our mood, our nutrition, our step count, and our sleep.
So, why is it so hard to quantify the impact of learning—and how can businesses make it easier?
That’s the challenge this guide will address. But first, we have to understand the problem.
The evolving landscape
The L&D function has evolved fast. 82% of global leaders believe learning and the HR function is more important now than it’s ever been[1].
Learning used to be about employee onboarding and compliance. Now it’s so much more: Sales enablement, customer education, and partner training are just a few use cases. Measurement hasn’t kept up.
It’s not just that L&D needs to prove its impact. It now has more to prove.
There’s no shortage of data on the general impact of learning:
- Two-thirds (66%) of companies expect to see a return on investment on skills training within one year[2].
- Companies that enable their frontline workers experience double the shareholder return[3].
- The average customer education program leads to a 6.2% increase in bottom-line revenue[4].
The issue is, this data is usually collected and aggregated by third-party analysts. Even if 94% of employees everywhere are more likely to stay with their employers if they’re learning[5], most L&D teams can’t prove that their learning program is having that impact.
To get there, teams will need to leverage technology and creativity to unlock better insights. Fortunately, it’s never been easier to do so.
| Aligning learning programs to business goals is the #1 focus for L&D teams[6]. | Despite this, the five most common success measures used by L&D teams are vanity metrics like learner satisfaction and course completions[7]. | Only 10% of teams strongly agree that they have a process for measuring learning impact[8]. Four in 10 have no strategy at all[9]. |
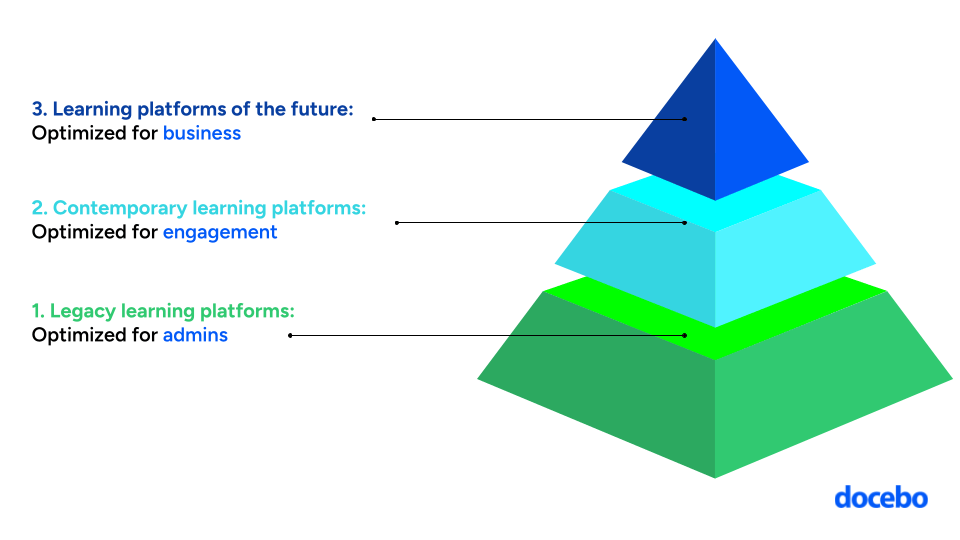
Evolving technology
Originally, learning systems were built for administrators. They were used for technical tasks and measurement was an afterthought.
As technology advanced, platforms became more learner-centric (which was code for employee-centric). This optimized for metrics like engagement, time spent learning, and course completions. And because most learning platforms today fall into this category, most learning metrics are vanity metrics. Vanity metrics are what these platforms were built for.
Now, learning is critical for every part of the business and organizations are training their customers, partners, and employees. Learning drives employee retention, customer renewals, skills acquisition, and revenue growth. And while most learning platforms are playing catch-up with this shift, there are a few that can help businesses impact the metrics that matter.
Metrics and measurement
Building out a measurement function isn’t easy—especially for an entirely new audience. But nearly all successful businesses are already measuring metrics like renewal rates, NPS, and average customer spend. This makes measuring the impact of learning easier, since you already have one half of the data.
Metrics impacted by learning
| Employees | Customers | Partners | Biz | Industry-specific |
|---|---|---|---|---|
| Skill acquisition Engagement Productivity Ramp time Retention rates Quota attainment | Renewal rates Average spend Customer acquisition cost (CAC) NPS Support tickets Call deflection | Sales performance Ramp time Customer awareness of products/services | Top line revenue growth Alternative revenue streams Customer acquisition cost Lifetime value | Mean time to repair Share of wallet Mean time to install Risk-adjusted return on capital Return on assets Average length of stay Overall equipment effectiveness |
Successful learning measurement often works this way: Start the business metrics you’re already collecting and then work backwards. This is far more efficient than starting with your learning data and then trying to track down the relevant business metrics.
As an example, consider customer education.
We know that customer education typically delivers incredible results:
+6.2% Bottom-line revenue growth
+7.4% Customer retention
+6.1 Cost savings on support
However, even if they have access to a strong customer education program, nearly half (47%) of customers don’t use these education offerings [10]. This suggests that rather than focus on making a great program even better, resources might be better allocated on increasing adoption. Customer education really is incredible.
This creates a natural experiment. Divide customers into two groups: Those who are engaged with your customer education program and those who aren’t. Then, compare those groups on the business metrics you already collect—like renewal rates, average spend, number of support tickets, NPS, etc.
This won’t give you a perfect picture, but it will be incredibly informative. And it’s likely to show you that customers who engage with learning stay longer, spend more, and are more likely to advocate for your brand.
This is the ROI of learning and it’s sure to get your C-suite excited.

When employees are learning, they’re not leaving
To find the impact of learning on your employees, you can use the same approach: look for natural experiments.
Step 1: Look at learners from a single group—this could be new hires, members of your sales team, employees who have received promotions or made internal moves, etc. Then, look at their learning metrics. You want to know the broad strokes of how much they engaged with learning, but also the specific courses they took, how they performed on each course, etc.
Step 2: You now have your experimental groups: Different sets of employees that are all part of the same original category. The simplest grouping is to have a learning group—made up of employees who had high learning engagement—and a control group, made up of employees who didn’t.
Step 3: Now, compare the performance of those two groups using the business metrics you care about. The math doesn’t have to be complicated. If you’re curious about learning’s impact on quota attainment, just average out the quota attainment of the learning group and the control group and compare the numbers. What you’ll find is that sales employees who engage with learning bring in more money. This is the ROI of learning.
Step 4 (optional): To go a step further, you can compare employees within the learning group to see which courses had the most profound impact on sales performance.
This process doesn’t always give you a causal picture, but it’s easy to do. And with some learning platforms offering native data tools, the average L&D team can pull out surprisingly deep insights. You don’t need to be a data scientist—you just need the willingness to experiment.
The ROI of learning tech
A critical shift in the learning landscape is redefining L&D (and HR) from a cost center to a revenue function.
Using the right learning technology impacts profitability in two ways:
Reducing costs associated with an organization’s tech stack, maintenance, and software ecosystem.
Increasing the effectiveness of learning itself. This means better employee productivity, customer loyalty, etc.
The first method is what gets all of the attention. After all, learning effectiveness is what a business wants from its L&D team. But the second factor shouldn’t be ignored.
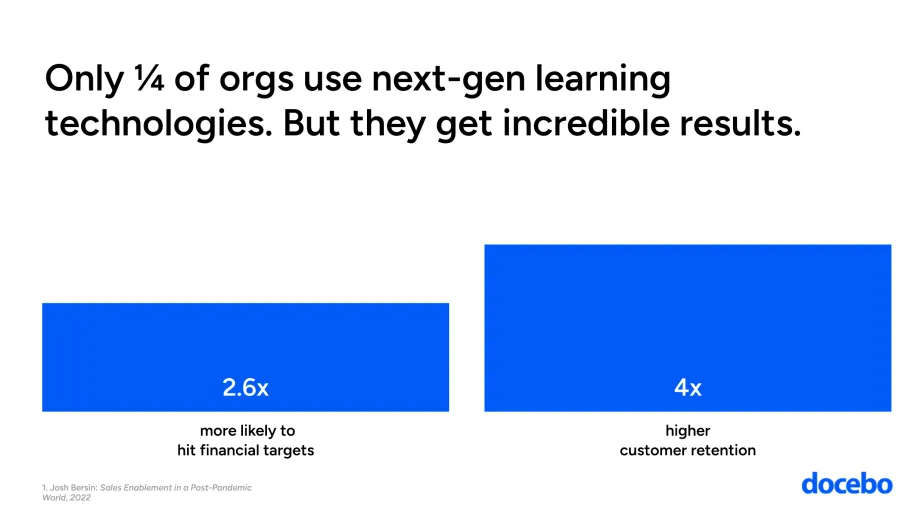
Using the right learning technology can have a profound impact on business success[11]:
But the story doesn’t end at business performance. Great technology can save costs and improve efficiencies in other ways.
Think about content: Most orgs have an insatiable appetite for content.. And with 44% of workplace skills being disrupted in the next five years[13], the need for high-quality content on in-demand skills is only growing.
But content is incredibly expensive to produce[14]:
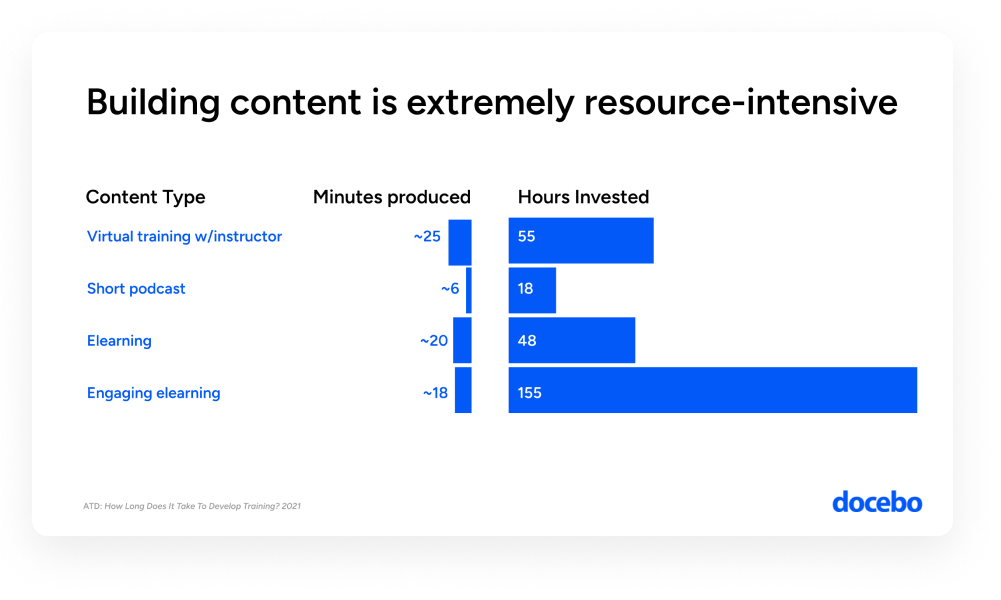
So—how are businesses supposed to keep up?
There are three options:
- Bite the bullet and make all the content themselves
- License it, usually from multiple vendors
- Generate it with AI
Here’s the problem: #1 is impossible. #2 is disorganized and expensive. The average business already has too many external vendors to keep them all straight, and adding a dozen new course providers is only going to increase confusion. Finally, #3 is risky and ineffective: Generative AI gets things wrong all the time, it isn’t optimized for pedagogy, and it can only respond based on its training data; it doesn’t know about the cool new product you haven’t launched yet.
This is where learning technology can come in. Integrated content marketplaces bring courses from different providers under one roof (and directly into the LMS). And there’s a coming wave of generative AI designed to learn from business’ internal materials and output pedagogically-sound learning assets.
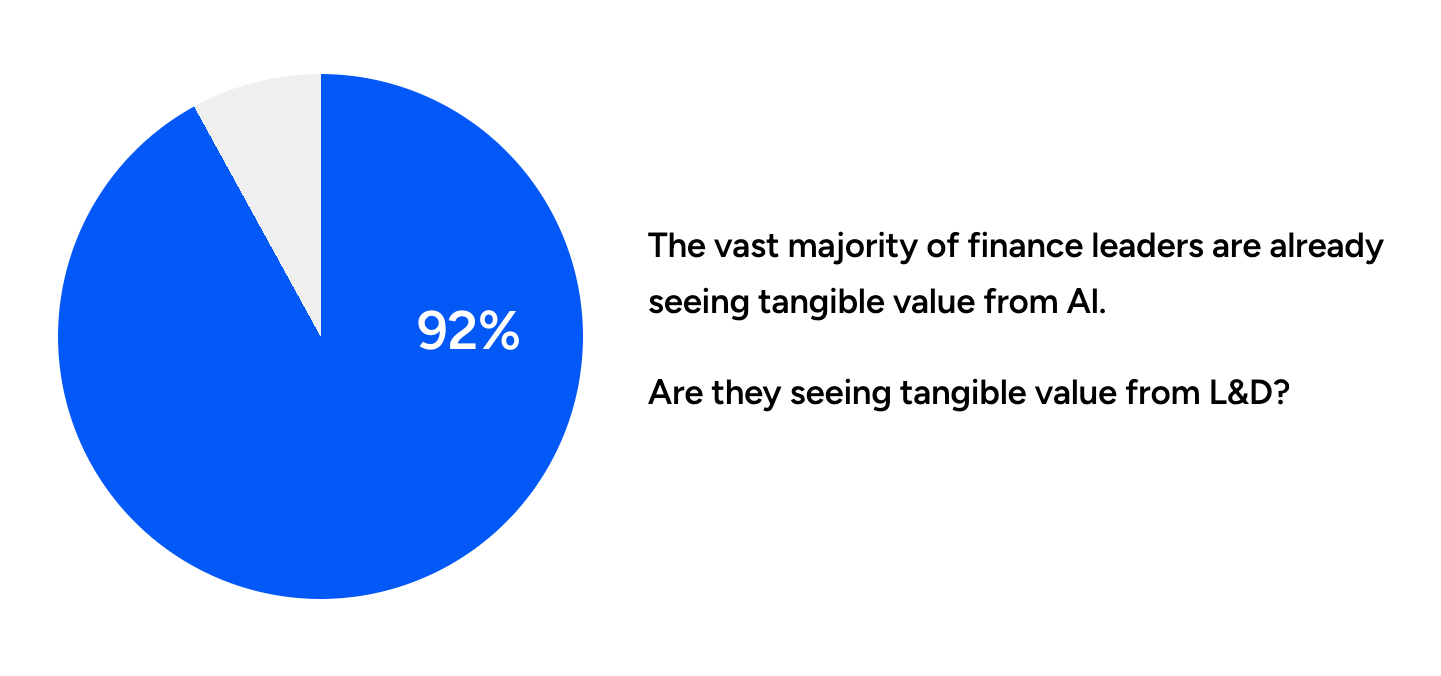
It’s important for L&D professionals to stay on top of new AI technology—because their colleagues certainly are. 92% of finance leaders are already seeing value from AI[15] and at 32% of organizations, a majority of employees are already using generative AI for work[16]. These numbers are climbing fast.utilizando la IA generativa para su trabajo[16]. Estas cifras están subiendo rápidamente. of employees are already using generative AI for work[16]. These numbers are climbing fast.
But it’s also important to exercise some restraint.
Removing the friction from content creation is great for subject matter experts and learning professionals. But when everyone can generate content, sometimes everyone does. This can lead to a flooded and disorganized information ecosystem and it can make learners feel overwhelmed.
That’s why it’s important to work with generative AI providers who have a deep understanding of L&D, specifically.
To ignore AI is to leave money on the table.
Next steps
The #1 focus for L&D teams in 2024 is aligning learning programs to business goals. And yet most organizations don’t have real data on the impact of their learning programs.
L&D is more important than ever. But to deliver on its promise, it needs to prove that it’s making a tangible difference.
To succeed, L&D teams don’t need a magic wand. They just need effective technology and the right data. Rather than start with learning data and then looking for the business results, we recommend starting with data your organization already collects—about things like sales performance and customer renewals. Then, look for ‘natural experiments’ where learning is a relevant variable.
Your learning programs are impacting the business. Isn’t it time leaders knew it?